
Comparing Minnesota Election Maps
Currently, there are excuses being made for election results when I think we should be seeing opportunities. I think Minnesota could be much bluer in all our elections. Many times I have heard the argument that history is destiny. However when I look at history, including the analysis of comparing the results with the resources used, I see incredible opportunity. For example, Democrat Bob Cuniff came within 13 votes of winning against Republican Mary Franson in the Alexandria area. Comparing urban, suburban and rural, I see differences in number of volunteers, monetary support, available expertise and even blog support. I think our biggest handicap is that money buys more contact in rural areas that can’t be easily filled in with low-cost DFL practices like doorknocking.
Below is are two maps that really display the range of DFL support. I would contend that if we have a vote for a DFL US Senator, then we have the possibility of winning that race for other DFL candidates. Minnesota Secretary of State Mark Richie is responsible for most of the excellent maps used in this article.

The constitution amendment maps are especially illuminating.
Defeating the threat to the right to marriage was done by metro strength, although every bit of support anywhere helped. Metro strength is important in the state wide races, yet the metro local races rarely are controversial. This means an uphill battle to get out the vote.
On the other hand, defeating the threat to voting rights had a strong element of the libertarian argument of “government messing with people”. This argument was used the rural areas. I like campaigns that use different persuasions in different areas. This is not lying unless the persuasions contradict each other. It just means that people value different things. So one person may voted against the constitutional amendments because of compassion for people who would have been hurt and another person voted against the same amendments because of the desire to keep government smaller.
So these two maps are a study in different paths to the same result.

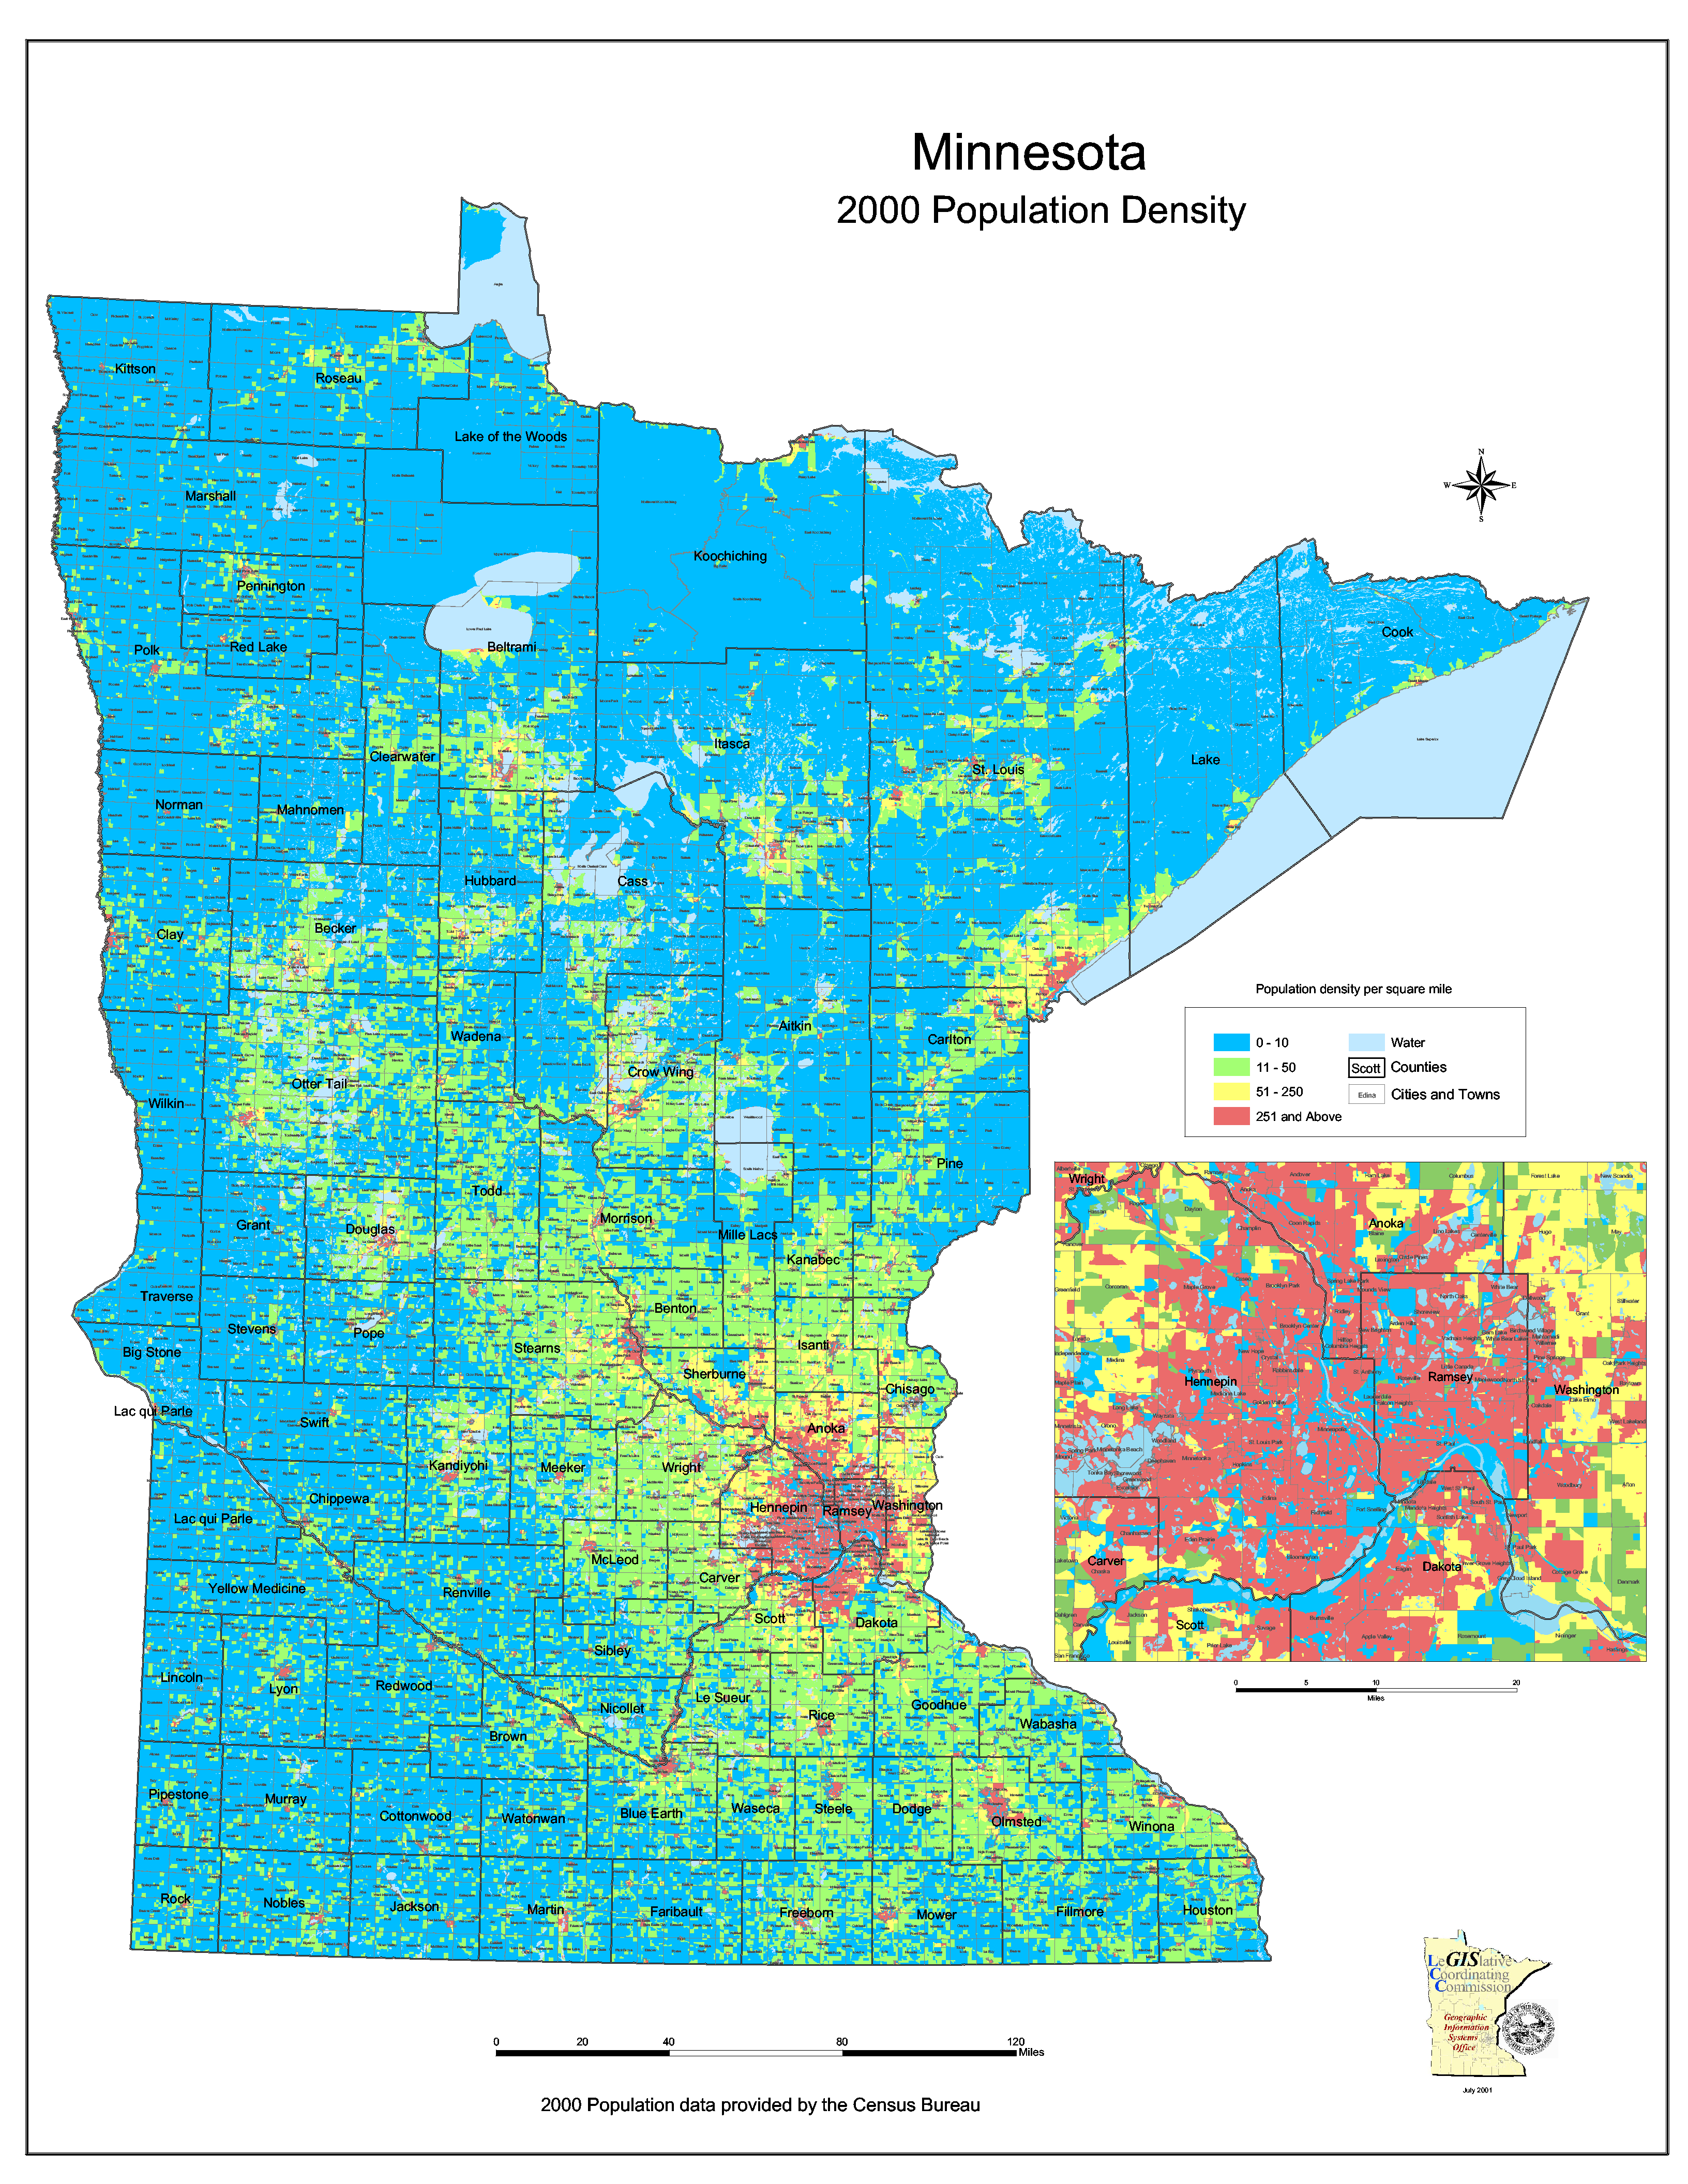
In looking at progressive support on Minnesota state maps, I tend to see a diagonal striping patten, one through St Cloud and one through the southwest corner.

This striping tends to match with population density. I think that money methods work better in rural areas with mailings and radio. In contrast, the DFL depends on the internet, local small papers, lit dropping and door knocking. There is also value matching where people who want to work together live in denser communities.

I wish I had a Minnesota voter map with counties re-sized by the number of voters. Basically the metro area really dominates. People tend to think of the solid urban DFL core surrounded by somewhat red donut of Republican support. That is somewhat misleading. A closer look at the suburbs shows substantial split-ticket voting. Similarly, education, which has been considered a Democratic issue, has won suburban races. An example is Jim Carlson winning in Eagan for state senate. I find in my door knocking experience, many side-by-side suburban neighbors with very different views. Research and testing is very recommended instead of using generalizations.
A hat tip of thanks to MPR for a reference to this excellent map.

Bonus Just for Fun: I could not help but notice that with the exception of one county there was a high correlation between the tornado zone and the Republican dominated areas in the state. My explanation is that the people who think ahead in buying decisions, consider factors like tornadoes. People who think ahead also tend to be Democrats.

No comments:
Post a Comment